Fourier Transform infrared (FT-IR) spectrometers have proven to be efficient and reliable tools for a large variety of applications targeting the near infrared (NIR) and mid-infrared (MIR) regions of the electromagnetic spectrum. One of the most critical specification of FT-IR spectrometers is their spectral resolution , as this defines the scale of the features to be distinguished e.g. in the absorbance spectrum of a gas. It is thus quite natural to wish for the highest achievable resolution when purchasing an FT-IR spectrometer. Due to their operational mode, achieving high resolution measurements using FT-IR spectrometers is however not entirely straightforward. This technical note explains the main limits of high resolution FT-IR measurements.
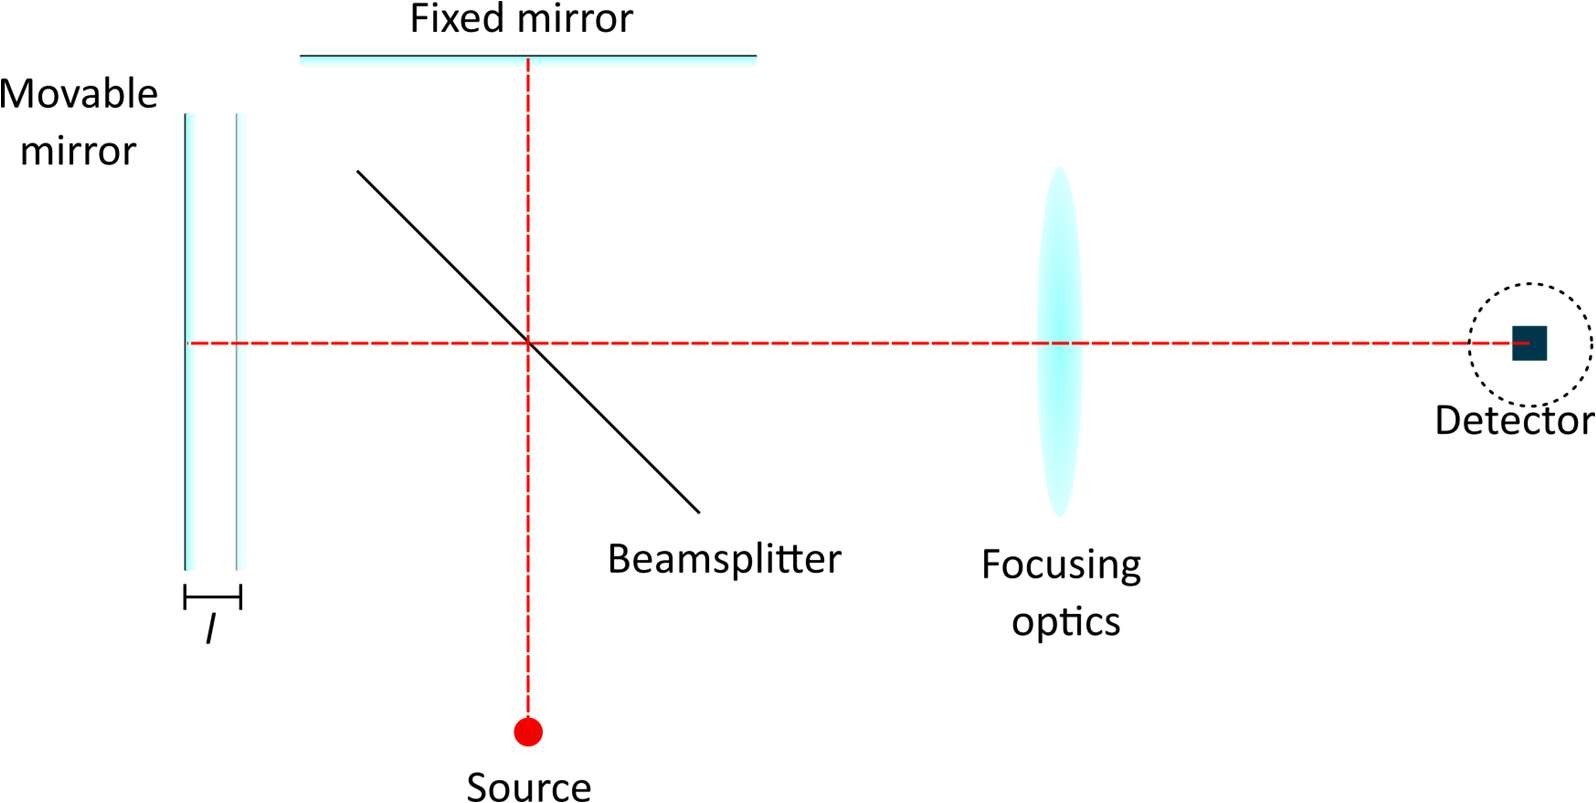
Figure 1. Simplified FT-IR setup
A simplified FT-IR is depicted in Fig.1. It consists of a beamsplitter, a fixed mirror and a movable mirror. Light from a purely monochromatic light source is split in two beams, assumedly in equal parts (50% beamsplitter). Each beam bounces back on either mirror (fixed or movable) before being recombined and focused onto the detector. When the movable mirror is at the same distance from the beamsplitter as the fixed mirror, both beams travel the same distance and recombine in-phase, yielding constructive interference. By displacing the moving mirror by a distance l, one introduces an optical path difference (OPD) between the two beams \( \Delta \) given by: \( \Delta = 2\ell \)
Upon recombination at the detector, the optical intensity as a function of OPD is given by:
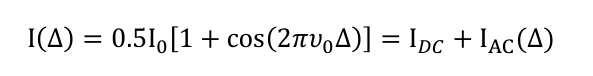
Where I0 is the source intensity at wavenumber u0 (the wavenumber is the reciprocal of the wavelength). The AC part of the interference record given in (2) is labelled \( \text{IAC}(\Delta) \) and is called the interferogram. For a purely monochromatic source (as considered here), the interferogram is a pure cosine function.
Figure 2. Interferogram of a purely monochromatic light source
Here the wavenumber (or equivalently the wavelength) of the source as well as its intensity can be retrieved from a direct observation of the interferogram (amplitude and period of the cosine function). For a broadband source, the interferogram \( \text{IAC}(\Delta) \) and spectrum \( I_0(\nu) \) of the source are related via a Fourier transform operation:
Obviously, the OPD cannot be made arbitrarily large and has to reach a value \( \Delta \text{max} \) that is defined by technological design. Given the nature of the relationship between the interferogram and the spectrum (Fourier transform), it turns out that \( \Delta \text{max} \) also defines the achievable spectral resolution. To a first approximation, the spectral resolution \( \Delta u \) of an FT-IR is given by
and is often expressed in cm-1. So why not simply increase the maximum OPD to enhance the spatial resolution of an instrument ? While this is true, special care has to be considered when operating at high resolution. As explained hereafter, the mirror maximum displacement is limited by the divergence of the system and the dimensions of the detector.
We consider the exact same setup as in Fig.1. The beam divergence is accounted for by observing the behavior of the so called "extreme ray", which makes an angle \( \alpha \) with respect to the "central ray" discussed previously.
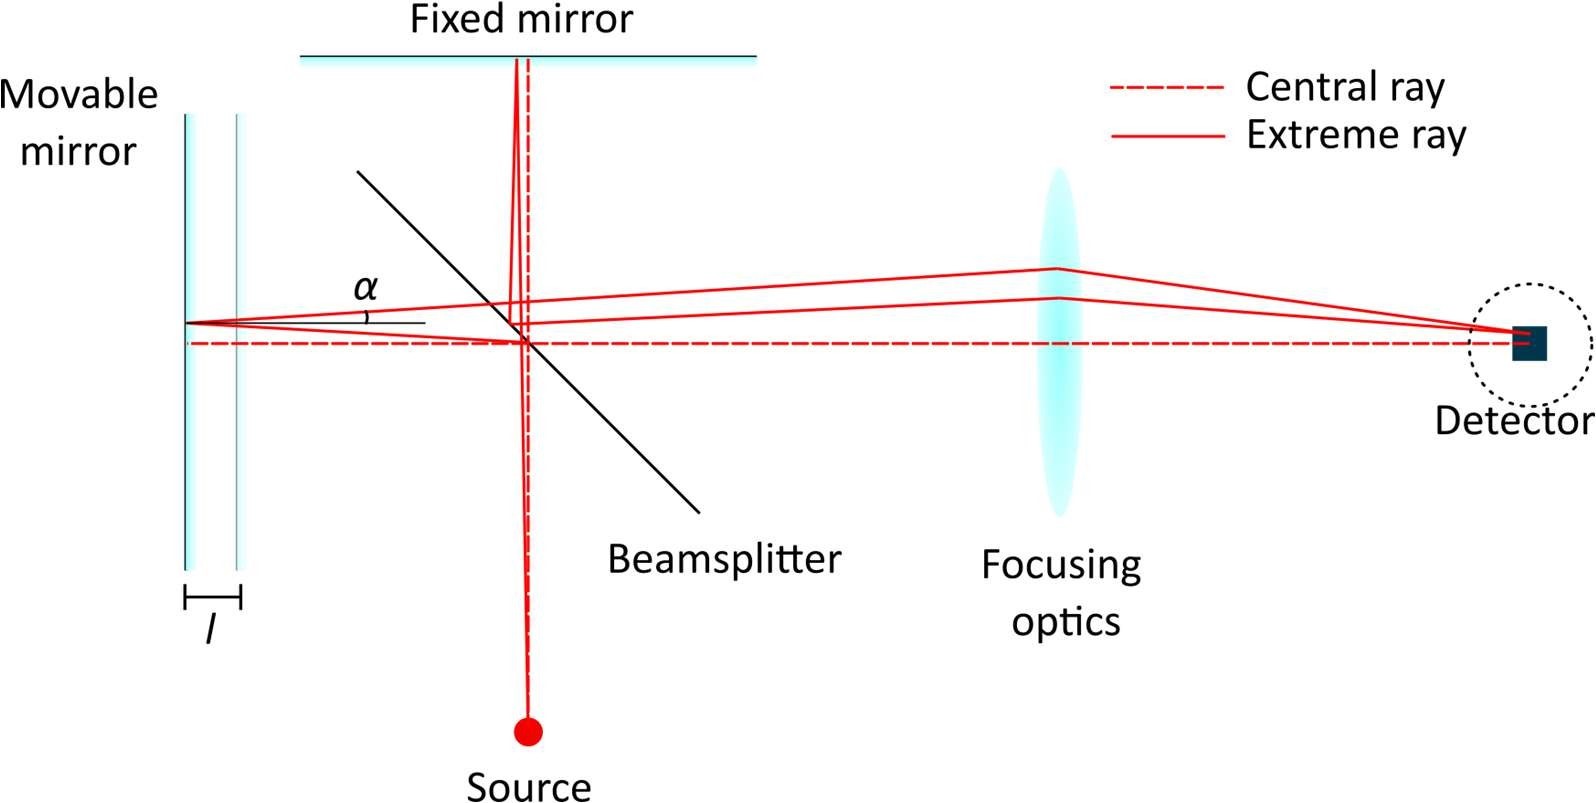
Figure 3. FT-IR setup with a divergent source
The two extreme rays (reflected from either the fixed or the moving mirror) hit the lens with an angle \( \alpha \), unlike the central ray which hits the lens at normal incidence. They are thus focused on another point on the detector. Moreover, their OPD is shorter than for the central ray:
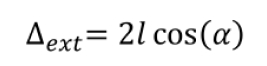
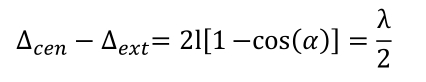
The larger the angle \( \alpha \), the greater the difference with the central ray OPD \( \Delta_{\text{cen}} = 2\ell \). Consider now the case where the difference in OPD between the central ray and the extreme ray is equal to one half of the source wavelength, that is:
In this scenario, when the central rays are in phase, then the extreme rays are out of phase (and vice versa). Consequently, the intensity over the detector surface follows the profile shown in Fig. 4.
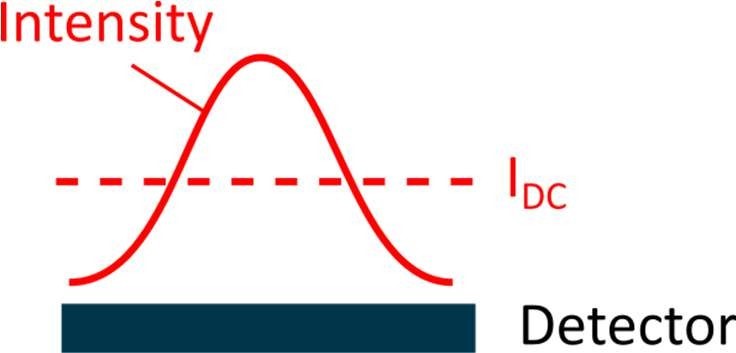
Figure 4. Intensity over the detector surface due to a highly diverging beam
Since the detector yields a single value that corresponds to the average intensity received on its surface, the signal detected in this case corresponds to the average optical intensity only, and all information regarding the interference signal vanishes. Practically speaking, the interferogram will start losing contrast as the moving mirror is scanned as shown in Fig. 5
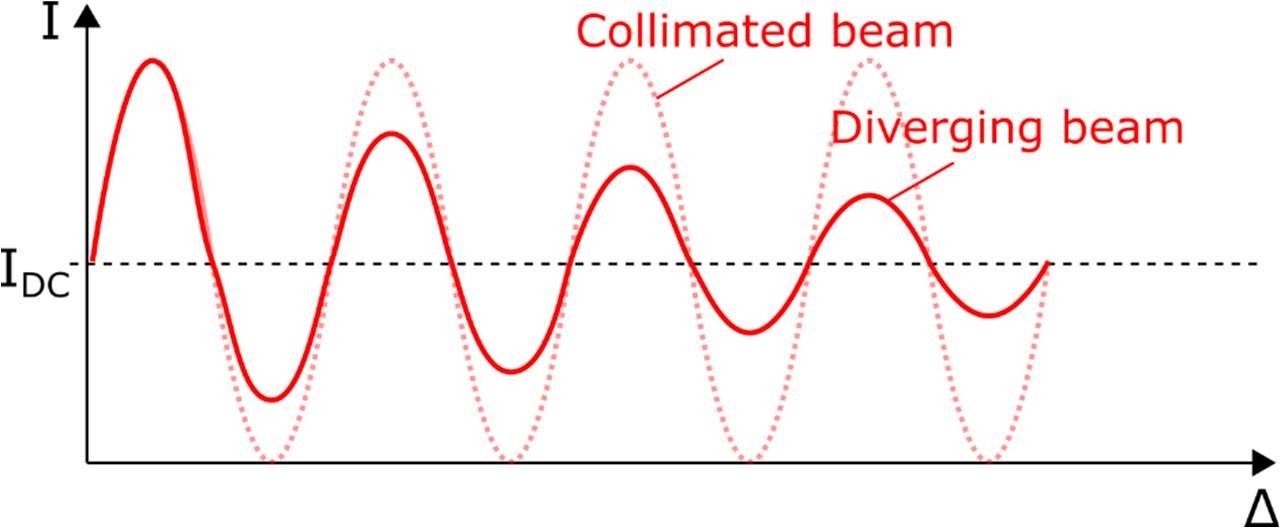
Figure 5. Loss in interferogram contrast due to a diverging beam
This effect is naturally existing in all interferometers based instruments (such as FT-IR) and cannot be avoided. It can however be properly managed by appropriately trading-off the parameters involved in equation (6), namely :
- \( \Delta u \): the effect is more pronounced for high resolution measurements due to the larger OPD required.
- \( \alpha \): the effect is more pronounced for a highly diverging beam.
- \( \lambda \): the effect is more pronounced at short wavelengths (large wavenumbers)
ARCoptix spectrometers are highly performing, stable, reliable and compact FT-IR. In most units, the source etendue (area times solid angle) is directly restricted by the detector size. The spectral resolutions made available in our units are given in the following table.
| ARCoptix FT-IR product | Resolution in cm -1 (software tunable) |
| FT-IR Rocket (NIR & MIR) | 16/ 8 / 4 / 2 / 0.5 (on request only) |
| FT-IR FC (NIR & MIR) | 16 / 8 / 4 / 2 |
| GASEX modules | 16/ 8 / 4 / 2 / 0.5 |
For most applications in solids and liquids, the size of the observable features is typically broader than 2cm-1, and high resolution (HR) measurements performed at 0.5cm-1 are usually not required. In addition, these would prove challenging due to the added contrast loss described in this document. HR measurements might still be a viable option for specific applications, such as e.g. laser characterization, where the highly collimated laser beam prevents the dramatic loss of the interferogram contrast.
Gas applications are usually more demanding in terms of spectral resolution, as the observable features (e.g. absorption lines) are far sharper than in condensed matter. Moreover, the beam etendue in our GASEX modules is restricted by an aperture located at the focal point of the beam, called a Jacquinot stop, and which ensures to reach a resolution of 0.5cm-1 as shown in Fig. 6.
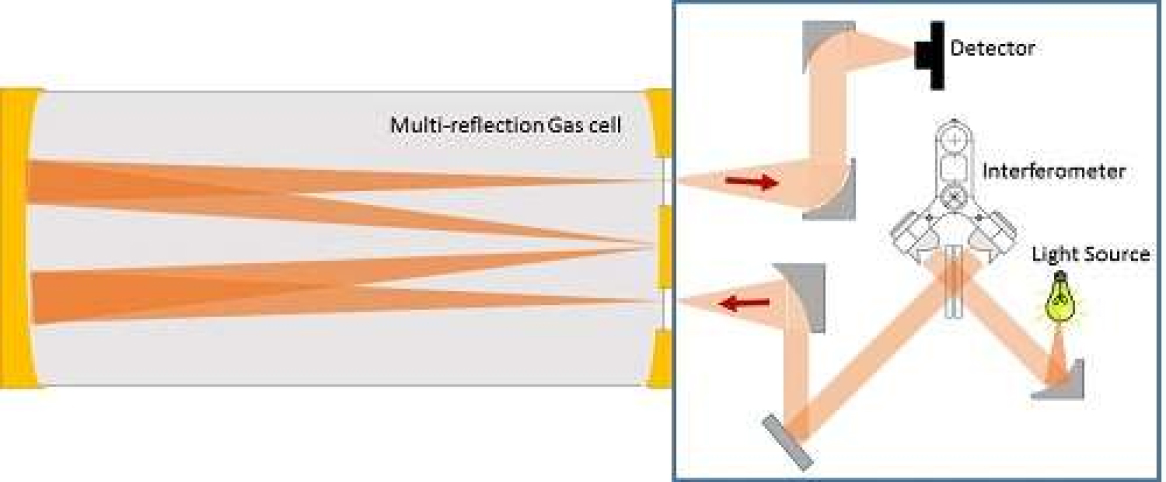
Figure 6. Jacquinot stop at the entrance of the gas cell in ARCoptix GASEX systems
Any question? Feel free to contact us at info@arcoptix.com, we are looking forward to hear from you.
